“Quiet whistle, 46 fouls, and I still called this crew average. Average my a**. McDaniels picked up six fouls and still dropped 14, which is more composure than I had all night.”
MONTY, THE MORNING AFTER
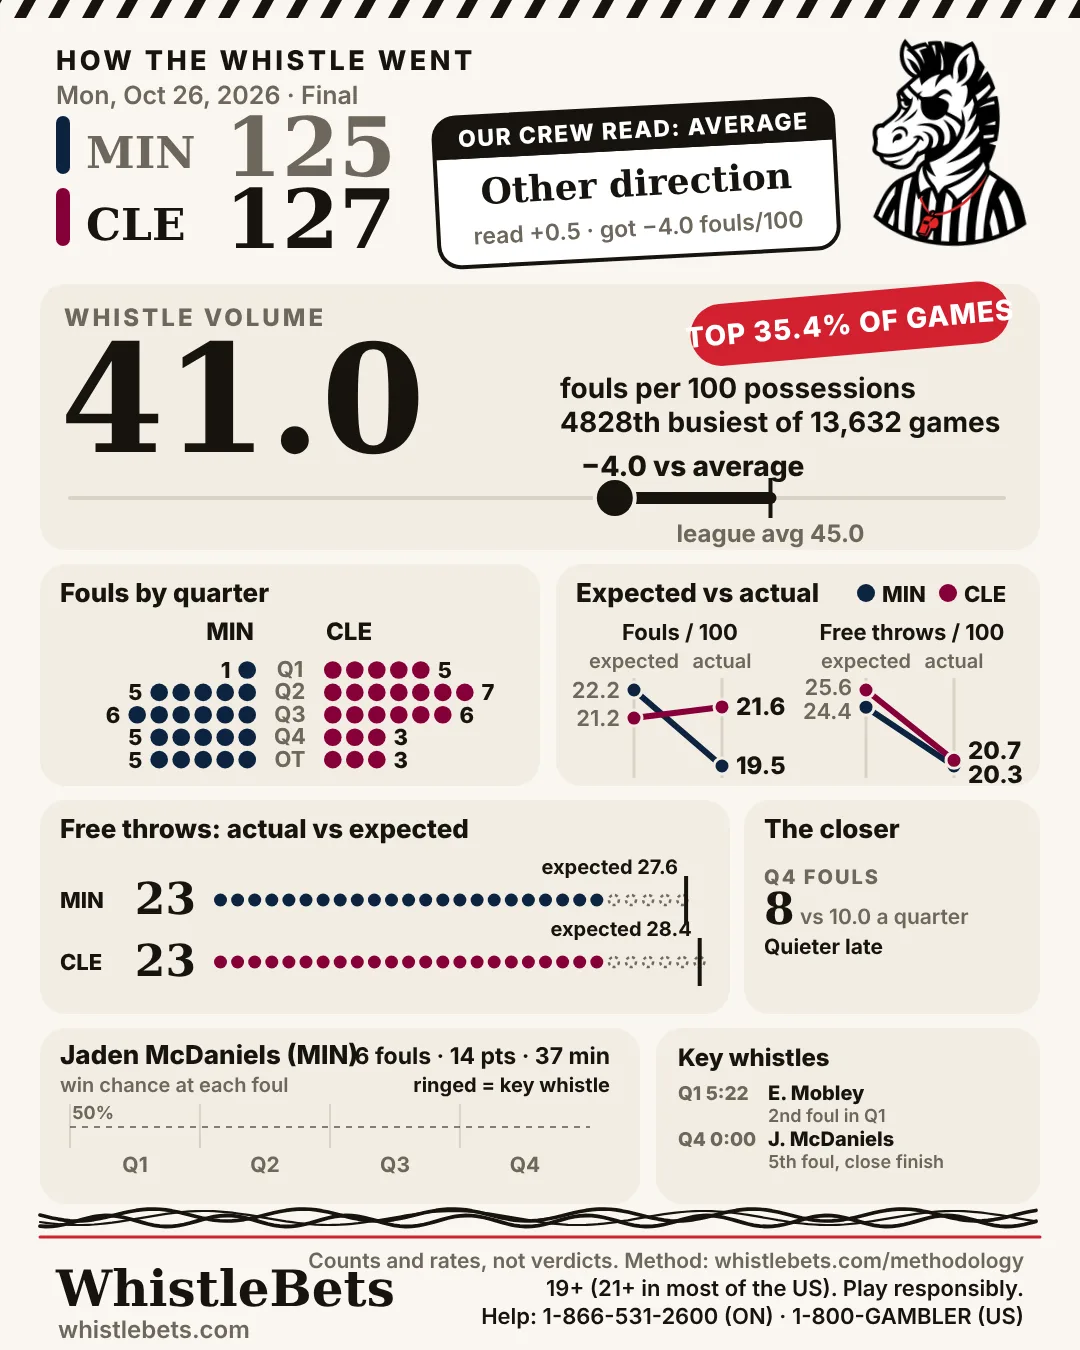
HOW THE WHISTLE WENT
Mon, Oct 26, 2026 · Final
MIN @ CLE Minnesota at Cleveland
THE CREWBill Kennedy(34)chief·Sean Wright(58)·Tyler Ricks(new)
MIN 125CLE 127
- Whistle-bait matchup
- Total moved up 2
WHISTLE VOLUME
41.0
fouls per 100 possessions · −4.0 vs average
4,828th busiest of 13,632 games since 2015
OUR CREW READ
Missed
Read as average before tip-off; it came in −4.0 fouls per 100 vs average.
We print the misses as loud as the hits.
Fouls by quarter
MIN CLE
Expected vs actual
| Fouls / 100 | Free throws / 100 | |
|---|---|---|
| MIN | 22.2 → 19.5 | 24.4 → 20.3 |
| CLE | 21.2 → 21.6 | 25.6 → 20.7 |
Expected before tip-off → what happened. Free throws: MIN 23, CLE 23.
Free throws: actual vs expected
Bar = free throws taken; tick = expected before tip-off.
The closer
8 Q4 fouls vs 10.0 a quarter before
Quieter late
8 of the Q4 fouls came with the game within 10 points, 0 with it wider.
Foul-trouble watch: Jaden McDaniels (MIN)
6 fouls · 14 pts · 37 min
Key whistles
- Q1 5:22 Evan Mobley (CLE), offensive foul: 2nd foul in Q1
- Q4 0:00 Jaden McDaniels (MIN), personal foul: 5th foul, close finish
- OT 3:14 Jaden McDaniels (MIN), personal foul: fouled out, close finish
Picked by rule (foul trouble, close finish), not graded right or wrong.
BEFORE TIP-OFF
CREW READ
PENDING
The league posts referee assignments about 9 a.m. ET on game day. The crew read lands here as soon as it does.
What this crew calls
vs league, 1.00× = average
A league-average call mix: no call type stands out.
- Offensive fouls and charges0.97×
- Shooting fouls0.99×
- Loose-ball fouls1.02×
- Take fouls0.96×
- Technical fouls1.05×
- Traveling0.97×
Per game in this crew's games since 2022-23, against league average; each official shrunk toward league until the games pile up. Every call counts for all three officials.
The free-throw battle
how busy each end should be
The busier end is when CLE have the ball.
When MIN have the ballLeans busy
quietleague middlebusy
MIN draw fouls: 7th most; get to the line: 8th most. CLE commit fouls: mid-pack; give up free throws: mid-pack. Expected free throws for MIN: 27.6.
When CLE have the ballBusy end
quietleague middlebusy
CLE draw fouls: 6th most; get to the line: 9th most. MIN commit fouls: 5th most; give up free throws: 9th most. Expected free throws for CLE: 28.4.
League ranks this season, out of 30.
Where they stand
MIN CLE
Overall
When they defend
When they attack
League rank out of 30 this season, 1st = best for the team: most points scored, fewest allowed, fewest fouls and free throws given up, most fouls drawn and trips to the line. The right-hand number is how many places the leader is ahead.
Pace
possessions per 48 minutes
97slower · faster107
- MIN 103.7 · 11th fastest
- CLE 103.1 · 14th fastest
- Expected tonight 103.4
- Actual 101.5 (−1.9 vs expected)
Crew’s pace lean: a touch slower (8th percentile of crews on the slate). Crews do nudge pace, but only by about 0.7 possessions between the fastest and slowest tenth; the teams decide almost all of it.
What to expect
vs league avg
MIN
27.6
free throws
CLE
28.4
free throws
Who’s out
MIN
Nobody listed
CLE
Nobody listed
Foul-trouble watch, by team
2 fouls in Q1 or 3 by half
MIN
- LaMelo BallVery high 2.5× typical
- Jonathan KumingaHigh 2.2× typical
- Rudy GobertElevated 1.6× typical
Facing a team that draws fouls 6th most in the league.
CLE
Facing a team that draws fouls 7th most in the league.
Early foul trouble usually costs a player about 2 minutes. Bands compare with every regular on the nights we cover.
The lines
DraftKings · open → close
| Total | 232.5 → 234.5▲ 2 |
|---|---|
| Spread | CLE -4.5 → -3.5 |
| Moneyline | MIN +142 → +130 · CLE -170 → -155 |
For information only. Prices move; check your book. 19+ (21+ in most of the US).
The crew read in detail: fouls, free throws and points vs the line
Fouls+0.5 per 100 poss not clear
Personal fouls by both teams per 100 possessions, against the league average, after allowing for the two teams.
Not clearly different from average: 80% likely between −0.2 and +1.3 per 100 poss.
n = 64 games (fewest on the crew). Each dot is one in twenty likely outcomes.
Free throws+0.3 per 100 poss not clear
Free-throw attempts by both teams per 100 possessions, against the league average.
Not clearly different from average: 80% likely between −0.6 and +1.2 per 100 poss.
n = 64 games (fewest on the crew). Each dot is one in twenty likely outcomes.
Points vs the line±0.0 points not clear
Final points minus the closing total in this crew's games. Near zero means the market already prices the crew.
Not clearly different from average: 80% likely between −0.9 and +0.8 points.
n = 64 games (fewest on the crew). Each dot is one in twenty likely outcomes.
Download the post-game card for sharing.
Counts and rates, not verdicts. One game is noise; we score the crew read by season: our track record.