“Chicago walked into Milwaukee's building and took it 132-125, and my "average crew" read got beaten up worse than the Bucks' defence. Forty-six fouls, quiet whistle, and I still called it wrong. This one's on me, not the zebras.”
MONTY, THE MORNING AFTER
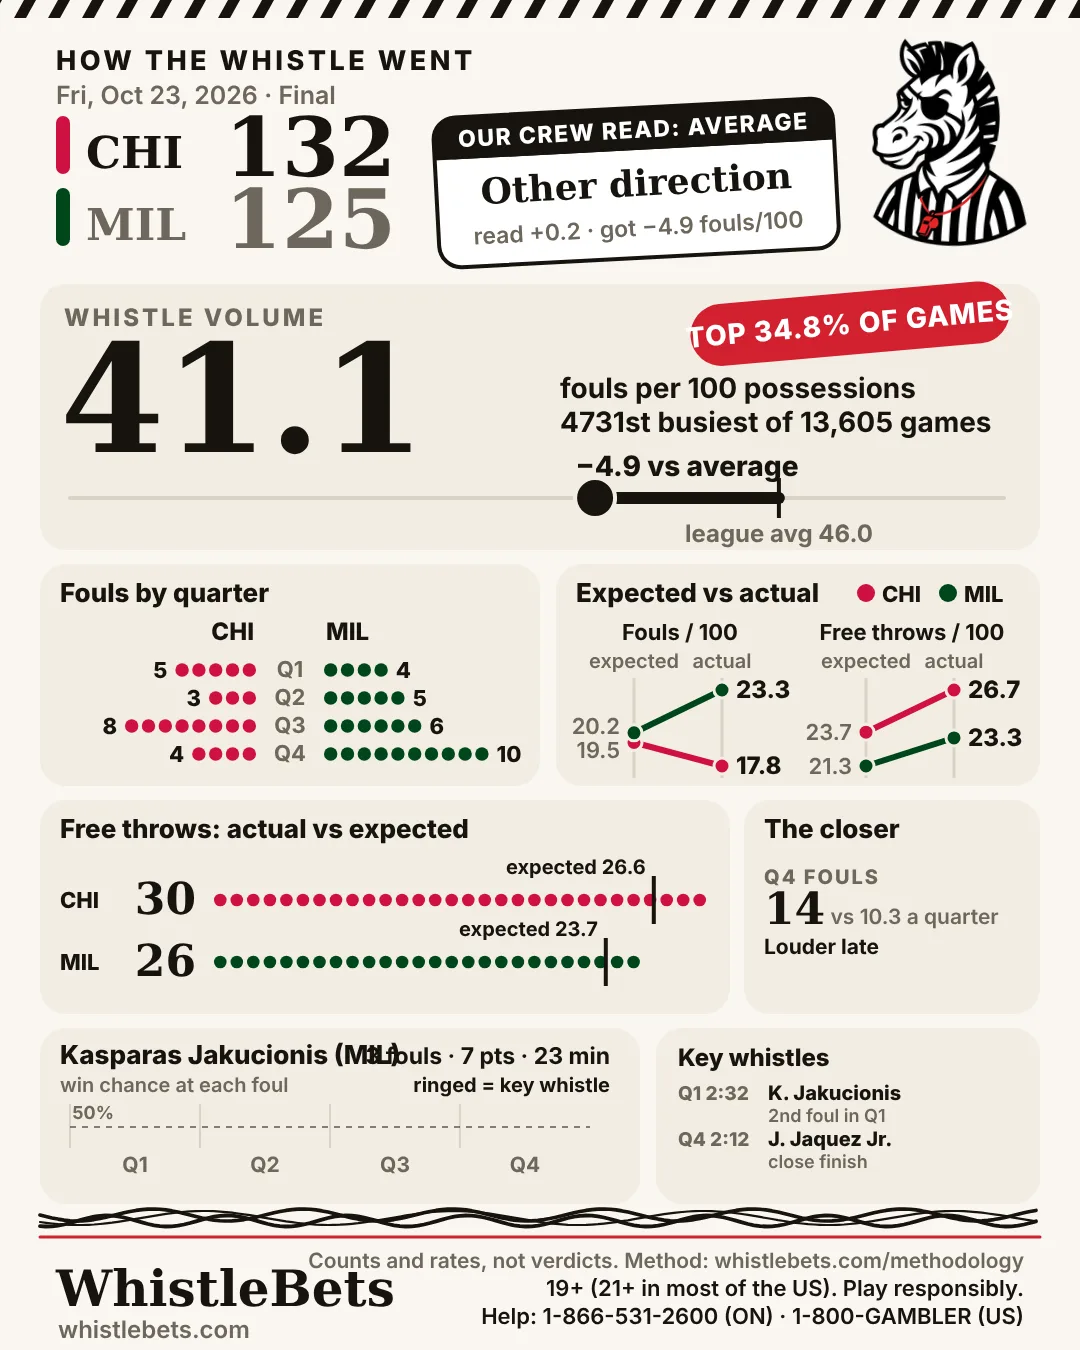
HOW THE WHISTLE WENT
Fri, Oct 23, 2026 · Final
CHI @ MIL Chicago at Milwaukee
THE CREWEd Malloy(42)chief·Ben Taylor(41)·Intae Hwang(new)
CHI 132MIL 125
- Total moved up 2
WHISTLE VOLUME
41.1
fouls per 100 possessions · −4.9 vs average
4,731st busiest of 13,605 games since 2015
OUR READ
On the number
Expected 39.7 fouls per 100 for both teams; it came in at 41.1 (+1.4).
The crew’s tendency alone read average.
Fouls by quarter
CHI MIL
Expected vs actual
| Fouls / 100 | Free throws / 100 | |
|---|---|---|
| CHI | 19.5 → 17.8 | 23.7 → 26.7 |
| MIL | 20.2 → 23.3 | 21.3 → 23.3 |
Expected before tip-off → what happened. Free throws: CHI 30, MIL 26.
Free throws: actual vs expected
Bar = free throws taken; tick = expected before tip-off.
The closer
14 Q4 fouls vs 10.3 a quarter before
Louder late
14 of the Q4 fouls came with the game within 10 points, 0 with it wider.
Foul-trouble watch: Kasparas Jakucionis (MIL)
3 fouls · 7 pts · 23 min
Key whistles
- Q1 2:32 Kasparas Jakucionis (MIL), personal foul: 2nd foul in Q1
- Q4 2:12 Jaime Jaquez Jr. (MIL), personal foul: close finish
- Q4 1:16 Kasparas Jakucionis (MIL), shooting foul: close finish
Picked by rule (foul trouble, close finish), not graded right or wrong.
BEFORE TIP-OFF
THE CREW’S TENDENCY
PENDING
The league posts referee assignments about 9 a.m. ET on game day. The crew read lands here as soon as it does.
What this crew calls
vs league, 1.00× = average
A league-average call mix: no call type stands out.
- Offensive fouls and charges1.02×
- Shooting fouls0.99×
- Loose-ball fouls1.01×
- Take fouls0.98×
- Technical fouls1.05×
- Traveling0.98×
Per game in this crew's games since 2022-23, against league average; each official shrunk toward league until the games pile up. Every call counts for all three officials.
The free-throw battle
how busy each end should be
CHI should get to the line more: about 2.9 extra free throws.
When CHI have the ballMiddle of the road
quietleague middlebusy
CHI draw fouls: 5th fewest; get to the line: mid-pack. MIL commit fouls: 10th most; give up free throws: 8th most. Expected free throws for CHI: 26.6.
When MIL have the ballQuiet end
quietleague middlebusy
MIL draw fouls: 2nd fewest; get to the line: 1st fewest. CHI commit fouls: 4th fewest; give up free throws: mid-pack. Expected free throws for MIL: 23.7.
League ranks this season, out of 30.
Where they stand
CHI MIL
Overall
When they defend
When they attack
League rank out of 30 this season, 1st = best for the team: most points scored, fewest allowed, fewest fouls and free throws given up, most fouls drawn and trips to the line. The right-hand number is how many places the leader is ahead.
Pace
possessions per 48 minutes
97slower · faster113
- CHI 105.5 · 3rd fastest
- MIL 100.4 · 23rd fastest
- Expected tonight 103
- Actual 111.8 (+8.8 vs expected)
Crew’s pace lean: neutral (50th percentile of crews on the slate). Crews do nudge pace, but only by about 0.7 possessions between the fastest and slowest tenth; the teams decide almost all of it.
What to expect
vs league avg
CHI
26.6
free throws
MIL
23.7
free throws
Who’s out
CHI
Nobody listed
MIL
Nobody listed
The lines
DraftKings · open → close
| Total | 239.5 → 241.5▲ 2 |
|---|---|
| Spread | MIL -1.5 → -1.5 |
| Moneyline | CHI -110 → -102 · MIL -110 → -118 |
For information only. Prices move; check your book. 19+ (21+ in most of the US).
The crew read in detail: fouls, free throws and points vs the line
Fouls+0.2 per 100 poss not clear
Personal fouls by both teams per 100 possessions, against the league average, after allowing for the two teams.
Not clearly different from average: 80% likely between −0.6 and +1.0 per 100 poss.
n = 65 games (fewest on the crew). Each dot is one in twenty likely outcomes.
Free throws−0.1 per 100 poss not clear
Free-throw attempts by both teams per 100 possessions, against the league average.
Not clearly different from average: 80% likely between −1.1 and +0.8 per 100 poss.
n = 65 games (fewest on the crew). Each dot is one in twenty likely outcomes.
Points vs the line+0.2 points not clear
Final points minus the closing total in this crew's games. Near zero means the market already prices the crew.
Not clearly different from average: 80% likely between −0.6 and +1.1 points.
n = 65 games (fewest on the crew). Each dot is one in twenty likely outcomes.
Download the post-game card for sharing.
Counts and rates, not verdicts. One game is noise; we score the crew read by season: our track record.